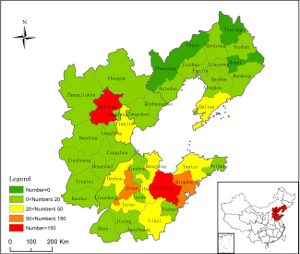
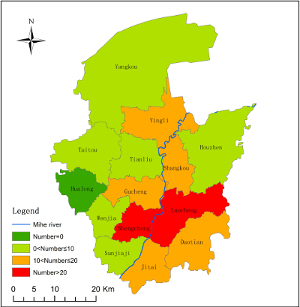
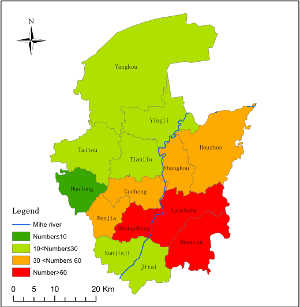
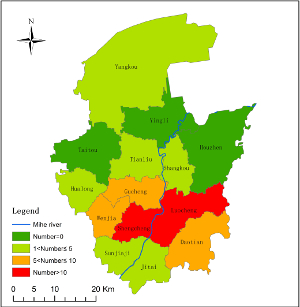
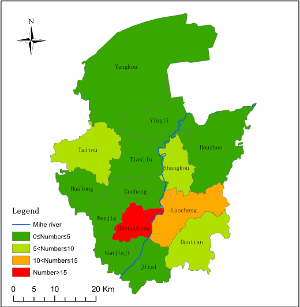
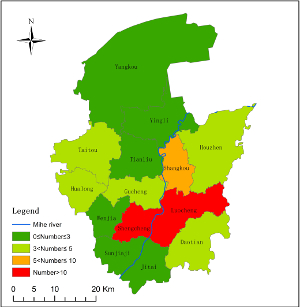
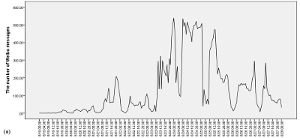
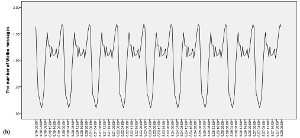
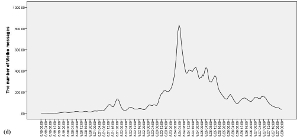
Social media has been applied to all natural disaster risk-reduction phases, including pre-warning, response, and recovery. However, using it to accurately acquire and reveal public sentiment during a disaster still presents a significant challenge. To explore public sentiment in depth during a disaster, this study analyzed Sina-Weibo (Weibo) texts in terms of space, time, and content related to the 2018 Shouguang flood, which caused casualties and economic losses, arousing widespread public concern in China. The temporal changes within six-hour intervals and spatial distribution on sub-district and city levels of flood-related Weibo were analyzed. Based on the Latent Dirichlet Allocation (LDA) model and the Random Forest (RF) algorithm, a topic extraction and classification model was built to hierarchically identify six flood-relevant topics (table1) and nine types of public sentiment (table2) responses in Weibo texts. The majority of Weibo texts about the Shouguang flood were related to “public sentiment”, among which “questioning the government and media” was the most commonly expressed. The Weibo text numbers varied over time for different topics and sentiments that corresponded to the different developmental stages of the flood. On a sub-district level, the spatial distribution of flood-relevant Weibo was mainly concentrated in high population areas in the south-central and eastern parts of Shouguang, near the river and the downtown area. At the city level, the Weibo texts were mainly distributed in Beijing and cities in the Shandong Province, centering in Weifang City. The results indicated that the classification model developed in this study was accurate and viable for analyzing social media texts during a disaster. The findings can be used to help researchers, public servants, and officials to better understand public sentiments towards disaster events, to accelerate disaster responses, and to support post-disaster management.
Table 1. Classification statistics of Weibo under different topics.
| All texts | Weather warning | Traffic conditions | Rescue information | Public sentiment | Disaster information | Other | |
| Number | 26963 | 53 | 89 | 976 | 22662 | 3124 | 59 |
| Percent | 100% | 0.20% | 0.33% | 3.62% | 84.05% | 11.59% | 0.22% |
Table 2. Classification statistics of nine sentiments.
| Topic | Number | Percent |
| Concerned about the disaster situation | 250 | 1.10% |
| Questioning the government and media | 14007 | 61.81% |
| Seeking help | 401 | 1.77% |
| Praying for the victims | 3461 | 15.27% |
| Feeling sad about the disaster | 844 | 3.72% |
| Making donations | 2068 | 9.13% |
| Thankful for the rescue | 480 | 2.12% |
| Worrying about vegetable prices | 1042 | 4.60% |
| Other | 109 | 0.48% |
| Total | 22662 | 100.00% |
Pictures

|
|
|
|
|
|
|
|

|

|
|
|
|
|
|
|
