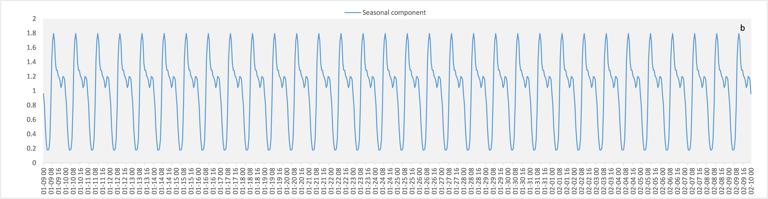

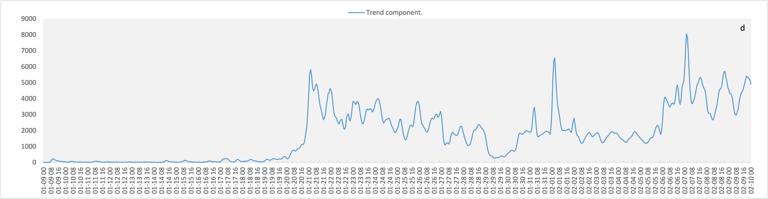
The results of the time series analysis of COVID-19-related Weibo texts are shown in Figure 1. Split by day, Figure 1a shows that the lowest point of the Weibo number on the curve for each day appeared at 04:00, after which the curve began to rise sharply. Figure 1b shows the lowest point of cyclical change occurring at 06:00 every day, with two daily peaks around 11:00 and 23:00. Figure 1c shows the seasonally adjusted time series, which shows the trend of the number of COVID-19-related Weibo after eliminating the seasonal factor. Figure 1d shows the trend component reflecting the trends of the number of COVID-19 related Weibo. After COVID-19 occurred, a slight increase appeared for a short time, then the amount increased sharply on January 20. The fluctuation reached a peak on January 21, and then began to decrease but fluctuated until January 29. The curve rose obviously on January 31 and reached a peak on February 1. It then steadily fluctuated from February 2 to 5, started to climb on February 6, and then steadily declined after reaching the highest peak on February 7.