The maturing of the computer age has greatly changed the manner in
which we can merge, compare, and manipulate multiple maps and other
data sets,. Computers and their software have significantly enhanced
data handling capacity and flexibility. A powerful new tool, known as
the Geographic Information System (GIS) emerged in the 1970s. Many of
those who developed GIS were inspired by the 1969 publication of the
classic *Design with Nature* by Ian McHarg (Doubleday/Natural
History Press), a leading landscape architect then at the University
of Pennsylvania. This document pointed the way to planning and
decision-making through comparative, integrated maps and related data
types. Since its inception, GIS has become a major growth industry,
now conducted worldwide at the multi-billion-dollar level. It has
blossomed into the main way for using maps (novel and practical) in
most endeavors that focus and rely on geographically-based data of
many kinds. Because remote sensing has routinely provided new images
of the Earth’s surface, it too has become intertwined with GIS as a
means to constantly and inexpensively update some of the GIS data
(such as land use and cover). The Association for Geographic
Information defines GIS as:
A system for capturing, storing, checking, integrating, manipulating,
analyzing, and displaying data which are spatially referenced to the
Earth.
A simpler working definition is: A computer-based approach to
interpreting maps and images and applying them to problem-solving.The
inclusion of computers to store, process, manipulate, interpret, and
display GIS information is the critical ingredient that separate modern
GIS from the more conventional (traditional) methods of using maps and
correlative data prior to the 1970s.
` <>`__15-6: In their book on GIS, J. Star and J. Estes (see
references at the end of this section) mention the four essential “M’s”
involved in the use of GIS by planners, resource managers, scientists,
and others. These are operations that are commonly carried out in
succession. Try to guess what these M’s are.
`ANSWER <Sect15_answers.html#15-6>`__
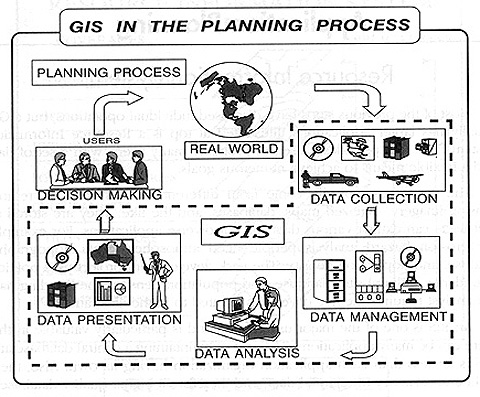
We synopsize the role of GIS in the general planning process for site
selection, environmental management, and other geographically-dependent
applications in this diagram:
From B. Davis, GIS: A Visual Approach, ©1996. Reproduced by permission
of Onword Press, Santa Fe, NM.
The driver for this closed-loop operation is the constant need for
timely information about human activities and expectations concerning
life in the real world. The specifics underlying those needs define
the types and amounts of data/information required. Once GIS users
stipulate the specifics, they collect the data from multiformed
sources, such as already published maps and tabulations, current field
observations, surveys, and aerial/satellite imagery. In the next step
they convert the varied data into computer-compatible formats. The
heart of the GIS operation lies within various techniques for analysis
that users have devised as GIS evolved. They then present their
reports, displays, new maps, statistics, and other kinds of
computer-based, information-oriented products to decision-makers. The
test of value then happens by applying the results in the same real
world that dictated the initial requirements. Data management through
a GIS involves all of these facets:

` <>`__15-7: What is the “driver” or key determinant in the above
Data Management diagram? `ANSWER <Sect15_answers.html#15-7>`__