Mapping the Extent of Flooding
Contents
This final page concentrates on various floods that were well monitored by space sensors.
Mapping the Extent of Flooding
This kind of information was a factor in predicting the major flood in the northern Midwest, late in the Spring of 1997. Satellite imaging gave a critical look at the great floods on the Red River in North Dakota and Manitoba (Canada) that inundated Grand Forks, Fargo, and other towns along the state’s border with Minnesota.
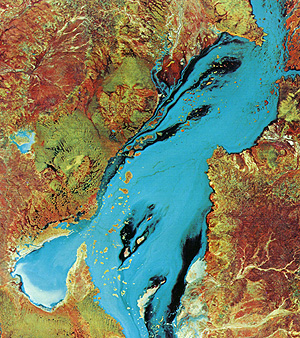
Mississippi, Missouri, and Illinois Rivers in normal flow; right view: same area experiencing a 100-year flood in March, 1973.|
Twenty years later, the Midwest again flooded, worse than before. After several months of excessive rain that saturated the soil, because of a blocking high pressure system that kept the jet stream relatively stationary, in late July and August of 1993, water levels rose well above flood stage. Areas hardest hit were from Iowa to southern Illinois. Levees broke, inundating tens of thousands of acres. The ‘93 flood became the costliest in U.S. history (some estimates approach $15 billion). Satellite imaging played a key role in getting a number of good images of the flooded area. An indication of how experts in the Weather Service, the Corps of Engineers, etc. go about studying this flood and other floods is found at this Earthsat Web Flooding site.
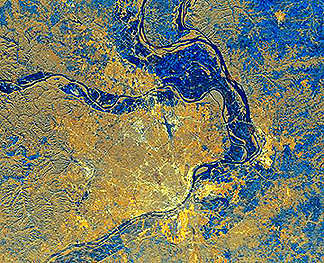
` <>`__14-41: Which year does the Mississippi flood seem worse? Why isn’t St. Louis flooded? **ANSWER**
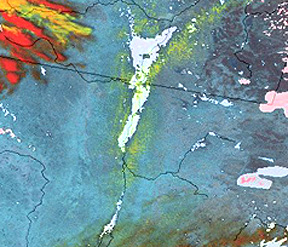
Up river during the same 1997, the SAR radar on ERS-2 showed the flood (mostly black tones) near Dubuque, Iowa:
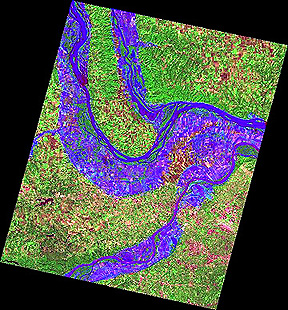
The Yangtse River in China underwent a major flood in August of 1998. Millions were driven from their lowlands homes. In this unusual image, an ERS-1 radar image taken during June of 1993 is joined with an ERS-2 radar image taken on August 1, 1998, providing a multitemporal or change detection rendition. Both blue and red associate with flood waters.

Finally, check this map showing areas with high soil moisture, a condition that bespeaks of water saturation from earlier heavy rainfall or from previous flooding. This soil wetness map shows much of Asia; maps of all the continents plotting this parameter are made by NOAA/NESDIS.
observations over much of Asia.|
This lengthy Section 14 purports to convey that the principal use of remote sensing remains surveillance of weather systems and oceans on local-to-global scales. We report this because of the widespread occurrence of water on the Earth’s surface (even greater than the 70+% ocean surface area, stated on page 14-1, if we include the Antarctic ice [which stores more than 80% of the world’s {frozen} fresh water] and Greenland.
At this point in the Tutorial, we have examined most of the specialized modes of remote sensing (defined by the electromagnetic spectral regions we can use), the spacecraft systems that mount the sensors, and the numerous applications to which these sensors have contributed. In the next Section (15), on Geographic Information Systems (GIS), we look at some systematic ways to integrate remote sensing data into organization, correlation, interpretation, and management of geographically-referenced information. Then, in Section 16, we look ahead to the next generation of remote sensing programs, in which individual satellites will simultaneously make meteorological, oceanographic, land surface, and biologic observations to present a unified picture of Earth as a System.
Primary Author: Nicholas M. Short, Sr. email: nmshort@nationi.net