The SPOT Satellite: A Case Study in Africa; Further Applications to Vegetation Mapping of Crops and Rangelands
Contents
The SPOT satellite, operated by the French, first mentioned in the Introduction, is here described in detail. Its earlier version produced three bands of data in the green, red, and near-IR segments of the spectrum. It also has a panchromatic band and can be pointed off nadir to give stereo imagery (dependent on passes near the scene on different days). SPOT is a competitor to Landsat but differs by having fewer bands but (compared to Landsats 1-5) higher resolution. Both SPOT and Landsat images covering an area in the East African Rift Zone of Kenya are examined, with special attention given to the appearance and classification of vegetation and crop fields. A second classification of a notable number of different crops growing along coastal Holland is included on this page as an indication of the versatility of Landsat TM data to identify crop types.
The SPOT Satellite: A Case Study in Africa; Further Applications to Vegetation Mapping of Crops and Rangelands
We interject the following synopsis of another operational satellite which, like Landsat, can provide very sharp and timely images well suited to agricultural analysis. We will then use SPOT to conduct a study of vegetation in Africa.
SPOT is an operational series of Earth-observing satellites, sponsored initially by the French government and managed by the French Space Agency, which, since the first launch in 1986, offers commercial multispectral data to users worldwide. From its 831 km (516 mi), sun-synchronous (10:30 A.M. equatorial crossing), near-polar orbit, SPOT revisits the same 117 km-wide (73 mi) ground tracks every 26 days, when its sensors look vertically downward (at nadir). However, operations can move its mirror sideways in both directions 27 degrees off-nadir, enabling it to view a 950 km-wide (590) corridor along its ground track. With careful planning, and optimal cloud conditions, it can revisit an area within this corridor seven times during a 26 day orbit cycle.
Images of the same area taken from different lateral angles on separate orbital passes can be paired, so that their parallax offsets permit stereoscopic viewing, thus facilitating a 3-D perspective of the area. These images are of great value to topographic analysts, geomorphologists, and others.
The payload sensor on SPOT is the HRV (High Resolution Visible). This name is slightly misleading, because in its multispectral mode, Band 3 operates in the near-IR wavelength over the interval 0.79 - 0.89 µm (Band 1 = 0.50 - 0.59 µm [green] and Band 2 = 0.6 - 0.68 µm [red]). A separate unit in the HRV can also image in the panchromatic mode as a single band encompassing 0.51 - 0.70 µm. Instead of an oscillating scan mirror, the tiltable mirror (set either on or off-nadir) sends light from a scene to a linear array of tiny detectors, known as charged coupled devices (CCDs). (See page I-5a for details on how these devices function.) The line of CCDs receives photons simultaneously and very rapidly discharges in sequence into an electron current stream. This array then reactivates with photons almost instantly, as the array line moves to the next ground position along the forward track. In the panchromatic mode, there are 6,000 detectors in the array, each receiving light from a 10 x 10 m ground area, thus providing a resolution of 10 m for an image of 60 km (37 mi) width. The multispectral HRV contains 3000 detectors in the array, providing a ground resolution of 20 m. On each spacecraft there are two such HRV arrays, mounted side-by-side, each viewing its own 60 km swath width but the pair of images sidelapping to give an effective 117 km (73 miles) wide coverage.
` <>`__3-4: What are the major advantages and disadvantages of Landsat compared with SPOT? `ANSWER <Sect3_answers.html#3-4>`__
Kenya and the African Rift Valley
Now that we’ve described SPOT, lets look at one of its images and see what you can spot (couldn’t pass up that one!). This example is an agricultural and forestry scene, just east of the town of Nakuru in Kenya, about 100 kms (60 mi) northwest of Nairobi, the capital . This town lies within the Great African Rift Valley of East Africa (described earlier on page 2-9) This rift zone, one of the largest in the world, is astride a regional uplift, where part of the eastern African continent is pulling away (an incipient divergent boundary in the plate tectonics model). Within the rift, parts of the crust are dropping a long normal faults in a series of one or more steps as shown in the figure below.

Some faults are young enough to remain relatively uneroded, so that they present a steep, often abrupt, face (called a scarp), separating the upthrown (upland) block from the downthrown (valley) block, as evident in the ground photos below.
which vegetation is sparse; the steep walls define the upthrown sides of Normal (type) faults.|
greater rainfall has modified the cliffs by erosion and the entire area is more heavily vegetated.|
Along much of the rift, the land is an arid, semi-desert savannah (left photo, above). In other segments, the scarp is older, and weathered, and may be covered in part with forest or dense shrub, such as in the lower or (right photo, above). Most of the rift zone is underlain by a sequence of basalt (volcanic) flow units. The next scene is a regional mosaic made from all or parts of nine Landsat MSS images, of much of Kenya that extends over an area about 500 km (311 mile) wide, east-west.
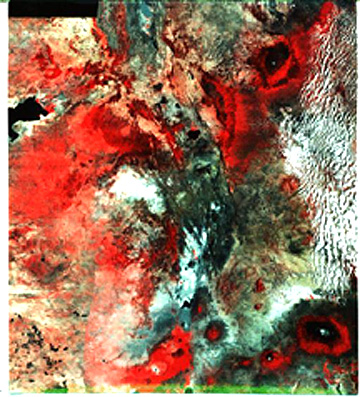

Look for major landmarks in this mosaic, including Mt. Kenya and Mt. Kilimanjaro in Tanzania, which are over 5,230 m (17,154 ft) high and therefore, snow-capped. The arrow points to the 10 km-wide subscene below, extracted from a full 60 km SPOT image, which was produced as a false color composite.
Some of the above ideas are implicit in the supervised, maximum likelihood classification of this scene, in which the classes chosen are: woods, grasses, newclear (new growth and cleared land), ltfield, medfield, dkfield (light, medium and dark fields). The results are quite believable, in that the color patterns tend to be homogeneous and their distributions are logical. The extent of newclear is somewhat greater than we can discern in black & white images. There are some black areas in the classified image. Those black areas that appear scattered are simply unclassified pixels. But several areas have definite shapes and are probably small lakes or ponds ( there are flamingo breeding grounds in this region).
Quite by serendipity, during the preparation of this caption, we discovered that the IDRISI program uses two special theme maps of the Nakuru region as part of its training exercises. With permission, we repeat these here. On the left is an image of map of elevations, in feet, showing the Rift Valley to be as low as 5,690 ft (1,734 m)in blue, and the western uplands to reach to greater than 9,850 ft (3,002 m) in yellow. The SPOT is scene somewhere in the upper right . The image on the right is another map, which plots the annual rainfall in millimeters (green is wettest, then red, yellow, and white is driest) (note that in this equatorial region of East Africa there are two rainy seasons: winter and summer). Try drawing your own relationships to the SPOT scene from these maps.
|
|


` <>`__3-6: Making a plausible guess from logic, in the Nakuru elevation map, where do you think the SPOT scene is located? `ANSWER <Sect3_answers.html#3-6>`__
While in Africa, make note of this unusual scene, in the desert of Sudan drained here by the Upper Nile. Water irrigated from this river has turned a once barren area into a vast array of farms (mostly cotton and millet). These are elongated in the style of the French Long Lot patterns (see also the wider scope image of this farming development on page 6-13.

Here is a stellar example of classification of crops, this time using a Landsat TM data set for July 7, 1993 that covers numerous farms along coastal Holland.

Unfortunately, the legend writing is obscured, but from top to bottom the crops are: Potato; Sugar Beets; Wheat; Grass; Maize; Rapeseed; Barley; and Lucerne (a type of alfalfa), and forest. Although colorful and rather convincing in its patterns, the accuracy of identification was only 56% - not uncommon when certain conditions needed to achieve higher accuracies are not met. We will encounter this scene again in page 13-4c during the discussion of multitemporal monitoring of crops.
As asserted on the previous page, the spectral response of vegetative matter does not show much difference between various species or types. The spatial aspect of crops, for example, in plant shapes, leaf arrangement, stage of growth, etc. are often the distinguishing factors. However, as was also stated, detailed spectral curves show subtle variations that can be diagnostic - hence, hyperspectral remote sensing is commonly the best tool for crop recognition, as was demonstrated using the Hyperion sensor. We underwrite that postulate with a look at the use of AVIRIS to identify and differentiate crops in the San Juan Valley near Summerville, Colorado. First, examine this set of spectral curves.
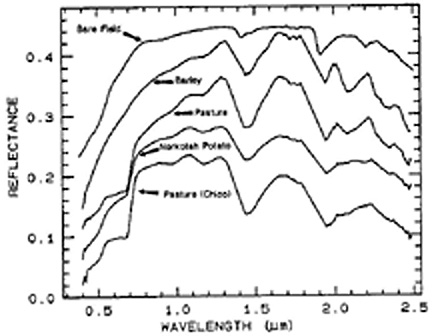
Using those curves, the fields (most circular for adaptability to pivot irrigation; see next page) were identified as to crop type using supervised classification, given this result (>80% accuracy).

Certain absorption bands and the height of a spectral curve for a given crop type will provide evidence of a deficiency of plant moisture that leads to a state of crop stress. Some of the individual field crops in the Summerville scene had insufficient moisture at the time AVIRIS sensed them during an aerial flyby. This map shows this condition:

Many legum crops such as wheat and barley resemble grasses. Both natural and planted grasses are commonly the prime crop in rangelands, where they serve as feed for grazing animals. Landsat TM data can identify and map grasslands, as is demonstrated in this example, reported by Dr. Paul Tueller of the University of Nevada-Reno, a world expert in this application. The TM subscene occur near the Organ Mountains in the piedmont covered by the open rangelands that occur within Fort Bliss, Texas (where NMS served his military career). First, the subscene, then the classification:

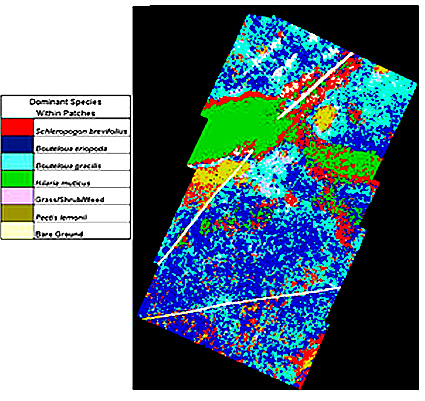
Although the legend is illegible, it shows six categories of vegetation, plus a modicum of bare land, a feat of identification that is impressive indeed.