The online map of China's August disaster distribution in 2014 is from the Atlas of natural disasters in China in 2014, the book is edited by the National Disaster Reduction Commission Office, the Disaster relief Department of the Ministry of Civil Affairs, the National Disaster Reduction Center of Ministry of Civil Affairs, and is published by China Map Publishing House. The scale of this map is 1:22000000.
Online map of China's August disaster distribution in 2014
Connect to the map above.
Disaster assessment in August:
1.Frequent earthquake activities, serious casualties in Ludian earthquake
In August, a total of 16 earthquakes with m ≥ 4 occurred in the mainland of China, and the overall frequency was slightly more than that in the same period in recent years. There were three earthquakes with m ≥ 5.0 in Jilong, Tibet on August 3, Ludian, Yunnan and Yongshan, Yunnan on August 17. Among them, the Ludian earthquake with M = 6.5 in Ludian, Yunnan Province, is the largest earthquake recorded in history in Ludian area, causing 617 deaths and 112 missing. Transportation, communication, power, farmland, water conservancy, rural water supply and other infrastructure were seriously damaged, which seriously affected the production and living of local people.
2.Less rainfall in the north, and the drought in the northeast, Huanghuai and other places is prominent
In August, the precipitation in most parts of Northeast China, North China, the north of Huanghuai River, Xinjiang and central Inner Mongolia was 20-50% less than that in August, and the drought in Northeast and Huanghuai regions developed rapidly. Among them, the average rainfall from the beginning of July to the last ten days of August in Liaoning and Jilin provinces and the average rainfall from the beginning of June to the last ten days of August in Henan Province are the lowest in the same period of local history since 1951. As a result, 18 provinces (autonomous regions and municipalities directly under the central government) including Hebei, Inner Mongolia, Liaoning, Jilin, Shandong, Henan, Hubei, Shaanxi and Ningxia were affected. Among them, Inner Mongolia, Liaoning, Jilin, Henan, Hubei, Ningxia and other provinces (autonomous regions) suffered serious disasters. Since the end of August, the northeast, Huanghuai and other places have obvious rainfall process, and the drought is relieved in some areas.
3.Light flood disaster, and no typhoon landed in China
In August, the average precipitation in China was slightly less than that in the same period of the year. Most of the southern part of the Yangtze River, the northern and southwestern parts of South China, most of Tibet and the central part of Gansu Province dropped 7W flat, more than 20-50% and more than one time more locally. Affected by precipitation, more than 100 rivers have exceeded the warning water level, 14 rivers have exceeded the guaranteed water level, and the tributaries of Weihe River in Shaanxi Province have exceeded the historical records. But in general, the process of heavy rainfall is less, and there is no serious flood disaster. Compared with the same period in recent years, the number of houses collapsed due to floods and geological disasters in August decreased by more than 80%, the number of people who died and disappeared, the number of people who were resettled in emergency and damaged houses decreased by more than 60%, and the direct economic losses decreased by more than 40%. In addition, in August, there were no typhoons in the Northwest Pacific and the South China Sea (there was only one typhoon moving in from the central Pacific), which was the year with the least number of typhoons in the same period since 1949, and also one of the years with the least number of typhoons landing in China, which is rare in the same period of history.
Various disasters:
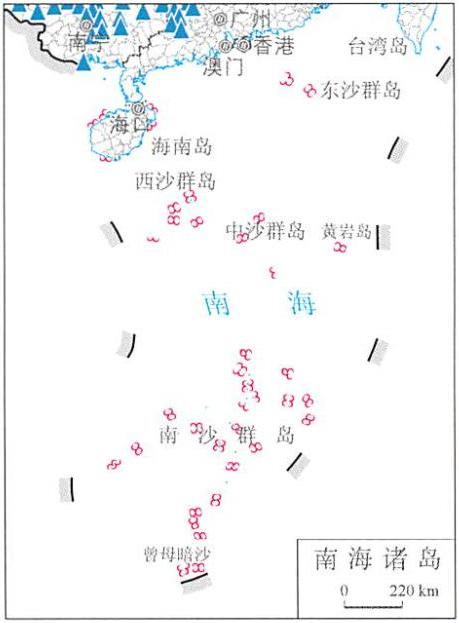
The yellow circle in the figure indicates: Drought disaster.
The blue triangle in the figure indicates: Floods and geological disasters.
The brown diamond in the figure indicates: Wind and hail disasters.
The green circle in the figure indicates: Typhoon disaster.
The pink triangle in the figure indicates: Earthquake disaster.
The purple diamond in the figure indicates: Low temperature freezing and snow disaster.
Note: data on Taiwan, Hong Kong and Macao are not available.
Online map of China's January disaster distribution in 2014
Online map of China's February disaster distribution in 2014
Online map of China's March disaster distribution in 2014
Online map of China's April disaster distribution in 2014
Online map of China's May disaster distribution in 2014
Online map of China's June disaster distribution in 2014
Online map of China's July disaster distribution in 2014
Online map of China's September disaster distribution in 2014
Online map of China's October disaster distribution in 2014
Online map of China's November disaster distribution in 2014
Online map of China's December disaster distribution in 2014
Comment list ( 0 )