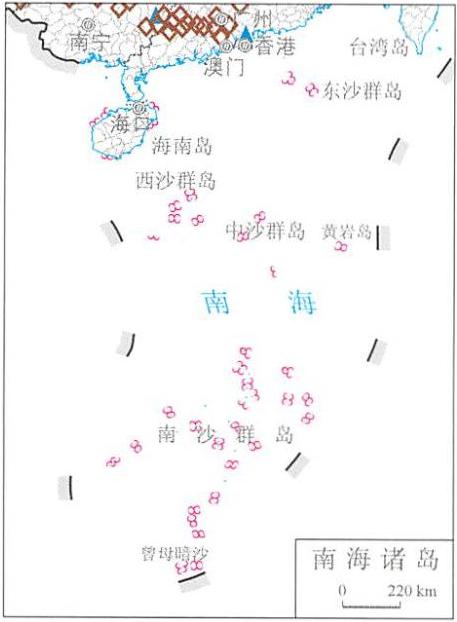
The online map of China's March disaster distribution in 2014 is from the Atlas of natural disasters in China in 2014, the book is edited by the National Disaster Reduction Commission Office, the Disaster relief Department of the Ministry of Civil Affairs, the National Disaster Reduction Center of Ministry of Civil Affairs, and is published by China Map Publishing House. The scale of this map is 1:22000000.
Online map of China's March disaster distribution in 2014

Disaster assessment in March:
1.Floods, waterlogging, wind and hail occurred concentratedly in southern China, and southern China entered the first flood season earlier
In March, two large-scale severe convective weather processes occurred in southern China, which caused 14 provinces (autonomous regions and municipalities directly under the central government) to suffer from floods, wind and hail disasters, resulting in heavy losses. Among them, from March 27 to 31, a large range of heavy rainfall and strong convective weather occurred in the south, causing floods, hails, landslides and other disasters, causing disasters in Fujian, Jiangxi, Hunan, Guangdong, Guangxi, Chongqing, Guizhou and other provinces (autonomous regions and municipalities directly under the central government), and part of the power and communication infrastructure were damaged. At the end of March, South China entered the pre flood season earlier, 7 days earlier than normal. Among them, the rainfall of more than 100 mm occurred in most of Guangdong Province, which was the largest in the same period in recent 10 years, and local rainstorm caused disaster.
2.The seismicity is active, and the influence of Zigui earthquake is more serious
In March, two earthquakes with magnitude ≥ 5 occurred in mainland China. Among them, after the 7.3 magnitude earthquake occurred in Yutian County, Hetian Prefecture, Xinjiang Uygur Autonomous Region on February 12, another earthquake with magnitude = 5.0 occurred in Yutian County on March 22. The epicenter of Hetian area belongs to the poverty-stricken area of Southern Xinjiang, with poor earthquake resistance capacity of civilian houses and weak self-help ability of the people in the disaster area. In addition, on March 31, NIMA County, Naqu Prefecture, Tibet Autonomous Region, a magnitude 5.5 earthquake, and on March 27 and 30, Zigui County, Yichang City, Hubei Province, successively suffered earthquakes of magnitude 4.3 and magnitude 4.7, which caused certain losses to the local area and aroused social concern.
Various disasters:
The yellow circle in the figure indicates: Drought disaster.
The blue triangle in the figure indicates: Floods and geological disasters.
The brown diamond in the figure indicates: Wind and hail disasters.
The green circle in the figure indicates: Typhoon disaster.
The pink triangle in the figure indicates: Earthquake disaster.
The purple diamond in the figure indicates: Low temperature freezing and snow disaster.
Note: data on Taiwan, Hong Kong and Macao are not available.
Online map of China's January disaster distribution in 2014
Online map of China's February disaster distribution in 2014
Online map of China's April disaster distribution in 2014
Online map of China's May disaster distribution in 2014
Online map of China's June disaster distribution in 2014
Online map of China's July disaster distribution in 2014
Online map of China's August disaster distribution in 2014
Online map of China's September disaster distribution in 2014
Online map of China's October disaster distribution in 2014
Online map of China's November disaster distribution in 2014
Online map of China's December disaster distribution in 2014
Comment list ( 0 )
